Southern Sidebars 🌵

The gecko stared at us quizzicaly.
"You're not around here, are you? Lost, I'm assuming?"
A quick, quiet nod answers its question.
"Hmm, well you can follow me and I'll lead you across the desert. In the meantime, you know what could help users and yourselves to navigate through large, complicated terrains? Sidebars."
The gecko looks at our blank stares and gives a wry smile,
"That's right, I'm the next step of your quest! Now listen closely..."
Southern Sidebars 01
Creating Sidebar Layout
Just like navbars, sidebars allow for easier navigation across dashboards, especially ones with multiple pages. While the navbar sits on top of the app and is horizontal, the sidebar can usually be found vertically on the left-side.
First, we must specify the styling of the sidebar, namely width, padding, and background color.
SIDEBAR_STYLE = {
    "position": "fixed",
    "top": 0,
    "left": 0,
    "bottom": 0,
    "width": "16rem",
    "padding": "2rem 1rem",
    "background-color": "#f8f9fa",
}
Using this style dictionary, we can create our sidebar layout.
sidebar = html.Div(
    [
        html.H2("Sidebar", className="display-4"),
        html.Hr(),
        html.P(
            "This is an example for TigerGraph's Dash Class", className="lead"
        ),
        dbc.Nav(
            [
                dbc.NavLink("Home", href="/", active="exact"),
                dbc.NavLink("Prescribers", href="/pre", active="exact"),
                dbc.NavLink("TG Cloud 🐯", href="https://tgcloud.io", active="exact"),
            ],
            vertical=True,
            pills=True,
        ),
    ],
    style=SIDEBAR_STYLE,
)
Breaking it down, we have:
- A header with our sidebar title (
html.H2()) - A paragraph with a short description (
html.P()) - Three nav links: one to home, one to prescribers, and one to TG Cloud
Now, we need to incorporate this sidebar into an example app.
CONTENT_STYLE = {
    "margin-left": "18rem",
    "margin-right": "2rem",
    "padding": "2rem 1rem",
}

content = html.Div(id="page-content", style=CONTENT_STYLE)

app = JupyterDash(__name__, external_stylesheets=[dbc.themes.BOOTSTRAP], suppress_callback_exceptions=True)

app.layout = html.Div([dcc.Location(id="url"), sidebar, content])


@app.callback(dash.dependencies.Output('page-content', 'children'),
              [dash.dependencies.Input('url', 'pathname')])

def render_page_content(pathname):
    if pathname == "/":
        return html.P("Congrats! You've found the home page!")
    elif pathname == "/pre":
        return html.P("Woah, you've discovered the Prescribers Page!")

    return dbc.Jumbotron(
      [
          html.H1("404: Not found", className="text-danger"),
          html.Hr(),
          html.P("Uh oh! Unfortunately, the pathname {} was unable to be recognised...".format(pathname)),
      ]
    )

app.run_server(mode='external')
First and foremost, we must create a new CONTENT_STYLE dictionary.
Note that the
margin-left is 18rem, accounting for both the sidebar's width and its padding (16rem and 2rem respectively).
Additionally, having a margin-right of 2rem allows for a flush appearance on both sides.
We must set the style of our content html.Div() element to match this!
Next, within our app.layout(), we must include both the sidebar and content. The rest of the app remains the
same, with the callback to navigate across both pages not requiring any changes.
And here's the simple sidebar app,
Let's customize this for our Healthcare Starter Kit Dashboard!
As we continue to trek across the desert, the gecko begins his next story...
Southern Sidebars 02
Adding Sidebar Elements
Let's add some more elements to our dashboard's sidebar. First, we declare our global variables.
SIDEBAR_STYLE = {
    "position": "fixed",
    "top": 0,
    "left": 0,
    "bottom": 0,
    "width": "16rem",
    "padding": "2rem 1rem",
    "background-color": "#424242",
}

WHITE = "#fffff8"
TG_LOGO = "https://i.ibb.co/gMMXcQB/Untitled-design-9.png"
PLOTLY_LOGO = "https://dash.plotly.com/docs../assets/images/light_plotly_dash_logo.png"
In addition to the style, we need to store shared colors as well as images we will be referencing as global variables for our dashboard. This allows for easier readability and easier modification of shared content.
Next, we can define the sidebar layout.
sidebar = html.Div(
    [
        html.Center(html.P(
            "A Plotly dashboard for TigerGraph's Healthcare Referrals Starter kit", className="lead", style={'color':"#ffcf9e"}
        )),
        html.Hr(style = {'borderColor':WHITE}),
        html.Center(html.P(
            "Use the following to navigate this dashboard", className="lead", style={'color':WHITE}
        )),
        dbc.Nav(
            [
                dbc.NavLink("Home", href="/", active="exact", style={'color':WHITE}),
                dbc.NavLink("Prescribers", href="/pre", active="exact", style={'color':WHITE}),
                dbc.NavLink("TG Cloud 🐯", href="https://tgcloud.io", active="exact", style={'color':WHITE}),
            ],
            vertical=True,
            pills=True,
        ),
        html.Hr(style = {'borderColor':WHITE}),
        html.Center(html.P(
            "To learn more, feel free to check out the following:", className="lead", style={'color':WHITE}
        )),
        html.Li(html.A("Inroduction to Graphs", href='https://www.tigergraph.com/blog/what-is-a-graph-database-and-why-should-you-care/', target="_blank", style={'color':WHITE}), style={'color':WHITE}),
        html.Li(html.A("Introduction to Dash", href='https://www.youtube.com/watch?v=e4ti2fCpXMI', target="_blank", style={'color':WHITE}), style={'color':WHITE}),
        html.Br(),
        html.Hr(style = {'borderColor':WHITE}),
        html.Br(),

        html.Center(dbc.Row(dbc.Col(html.Img(src=TG_LOGO, width="175px", style={"margin-bottom": "15px", "margin-top":"50px"})))),
        html.Br(),
        html.Center(dbc.Row(dbc.Col(html.Img(src=PLOTLY_LOGO, width="225px", style={"margin-bottom": "15px"})))),
    ],
    style=SIDEBAR_STYLE,
)
Let's dissect this new sidebar,
- First, we have our centered title, in a different color than before. This is because the background color of our sidebar is now a darker shade of grey, meaning all text should be lighter colors.
- Next, we have a standard horizontal rule, however colored white instead of the usual grey.
- Following this is another short description, in the color white to allow for easier readability.
- This next section hasn't changed, it simply contains our
dbc.Nav() - After another white horizontal rule, we have a shot description for further resources
- Using the
html.Li()component, we can include hyperlinks to external webpages. Although this can be achieved usingdcc.Link()(as we covered in a previous chapter), it never hurts to learn multiple ways for accomplishing a given task! Both provide similar functionality. - Finally, we have two centered images. Our TigerGraph and Plotly Dash logos. With
html.Img(), we can specify width, height, and margins. These are stored indbc.Row()anddbc.Col()to provide consistent borders.
Now, it's time to incorporate this sidebar into our app.
First, we need to reformat our figures and page layouts to account for the change in width.
pieChart = getClaimsPieChart()
scatterChart = getScatterChart()

pieChartCard = dbc.Card([
                  dbc.CardBody([
                                html.H1("All Submitted Claims", className='card-title'),
                                html.P("Which categories of claims are most frequent?\n Which areas should prescribers focus on?", className='card-body'),
                                dcc.Graph(id='Pie Chart', figure=pieChart)
                              ])
                ],
                outline=True,
                color='info', # Options include: primary, secondary, info, success, warning, danger, light, dark
                style={
                    "width":"49rem",
                    "margin-right":"1rem",
                    "margin-bottom":"1rem"
                    }
              )

scatterChartCard = dbc.Card([
                  dbc.CardBody([
                                html.H1("Prescriber Communities", className='card-title'),
                                html.P("Do communities lead to more business? How do the number of referrals compare to community size?", className='card-body'),
                                dcc.Graph(id='Scatter Chart', figure=scatterChart)
                              ])
                ],
                outline=True,
                color='info', # Options include: primary, secondary, info, success, warning, danger, light, dark
                style={
                    "width":"50rem",
                    "margin-left":"1rem",
                    "margin-bottom":"1rem"
                    }
              )
def getPrescriberInfo(person_num):
  network = getNetwork(person_num)
  number, table, bar, max_title = getClaims(person_num)

  prescriberTitleCard = dbc.Card([
          dbc.CardBody([
                        html.Center(dbc.Badge([html.H1("  Prescriber " + person_num + "'s Claims  ", className='card-title')], color="light")),
                        html.Center(html.P("This individual has a total of " + repr(number) + " claims. Their most referred to specialization is: " + max_title, className='card-body')),
                      ])
        ],
        outline=True,
        color='info',
        style={
            "width":"95rem",
            "margin-left":"1rem",
            "margin-bottom":"1rem",
            "margin-top":"1rem",
            "margin-right":"1rem"
            }
      )

  tableCard = dbc.Card([
          dbc.CardBody([
                        html.H1("Claims by Prescriber", className='card-title'),
                        html.P("A detailed description of each claim...", className='card-body'),
                        table
                      ])
        ],
        outline=True,
        color='info',
        style={
            "width":"48rem",
            "margin-left":"1rem",
            "margin-bottom":"1rem",
            "margin-top":"1rem"
            }
      )

  barCard = dbc.Card([
          dbc.CardBody([
                        html.H1("Claims by Category", className='card-title'),
                        html.P("Which claims are being prescribed most?", className='card-body'),
                        dcc.Graph(id='Bar Chart', figure=bar)
                      ])
        ],
        outline=True,
        color='info',
        style={
            "width":"48rem",
            "margin-left":"0rem",
            "margin-bottom":"1rem",
            "margin-top":"1rem"
            }
      )

  networkCard = dbc.Card([
          dbc.CardBody([
                        html.H1("Prescriber Network", className='card-title'),
                        html.P("Who's part of this prescriber's community?", className='card-body'),
                        network
                      ])
        ],
        outline=True,
        color='info',
        style={
            "width":"48rem",
            "margin-left":"0rem",
            "margin-bottom":"1rem",
            "margin-top":"1rem"
            }
      )

  return prescriberTitleCard, tableCard, barCard, networkCard
generalPage = html.Center(html.Div([
                dbc.Col(dbc.Button(
                      "Switch Pages", id="switch-button",
                      className="mr-2", n_clicks=0, color="info", href="/pre"
                    ),
                    width=2
                ),
                dbc.Row(titleCard, justify="center"),
                dbc.Row(statsListGroup, justify="center"),
                html.Br(),

                dbc.Row([
                  pieChartCard,
                  scatterChartCard,
                  ],
                  justify="center"
                ),

              ], style={"width":"100rem"}))

dropdown = dbc.Row(dbc.Col(
                    dcc.Dropdown(
                      id="pres-dropdown",
                      placeholder="Enter a prescriber..." ,
                      options=getPresList(),
                      style={'width':'400px'}
                    ),
                   width=12, align="end"
                  ), style={"margin-left":"35rem"})

navbar = dbc.Navbar(
    [
        html.A(
            # Use row and col to control vertical alignment of logo / brand
            dbc.Row(
                [
                    dbc.Col(dbc.NavbarBrand("Healthcare Dashboard - TigerGraph's Dash Class Example", className="ml-2")),
                ],
                align="center",
                no_gutters=True,
            ),
            href="/",
        ),
        dropdown,
    ],
    color="dark",
    dark=True,
)

def prescriberPage(pres):
  prescriberTitleCard, tableCard, barCard, networkCard = getPrescriberInfo(pres)

  page = html.Center(html.Div([
            navbar,
            prescriberTitleCard,

            dbc.Row([
              dbc.Col(tableCard),
              dbc.Col([
                      barCard,
                      networkCard
                      ],
                  )
                ],
                justify='center'
            ),
        ], style={"width":"100rem"}))

  return page
Now, we can incorporate our sidebar into the app.layout.
It's important
to note that only page-content contains CONTENT_STYLE. Our pres-content page
doesn't require this styling as it is not part of our app.layout directly. Instead,
it is returned to substitute page-content.
CONTENT_STYLE = {
    "margin-left": "18rem",
    "margin-right": "2rem",
    "padding": "2rem 1rem",
}

app = JupyterDash(__name__, external_stylesheets=[dbc.themes.BOOTSTRAP], suppress_callback_exceptions=True)

presPage = html.Div(prescriberPage("pre78"), id='pres-content')

app.layout = html.Div([
    dcc.Location(id='url', refresh=False),
    sidebar,
    html.Div(id='page-content', style=CONTENT_STYLE)
])

@app.callback(dash.dependencies.Output('page-content', 'children'),
              [dash.dependencies.Input('url', 'pathname')])

def display_page(pathname):
  if pathname == "/":
    return generalPage
  elif pathname == "/pre":
    return presPage

  return dbc.Jumbotron(
        [
            html.H1("404: Not found", className="text-danger"),
            html.Hr(),
            html.P("Uh oh! Unfortunately, the pathname {} was unable to be recognised...".format(pathname)),
        ]
    )

@app.callback(dash.dependencies.Output('pres-content', 'children'),
              [dash.dependencies.Input('pres-dropdown', 'value')])

def update_pres(value):
  if value is not None:
    return prescriberPage(value)

  return prescriberPage("pre78") # Our default value


app.run_server(mode='external')
And here's our output, both pages complete with the sidebar!
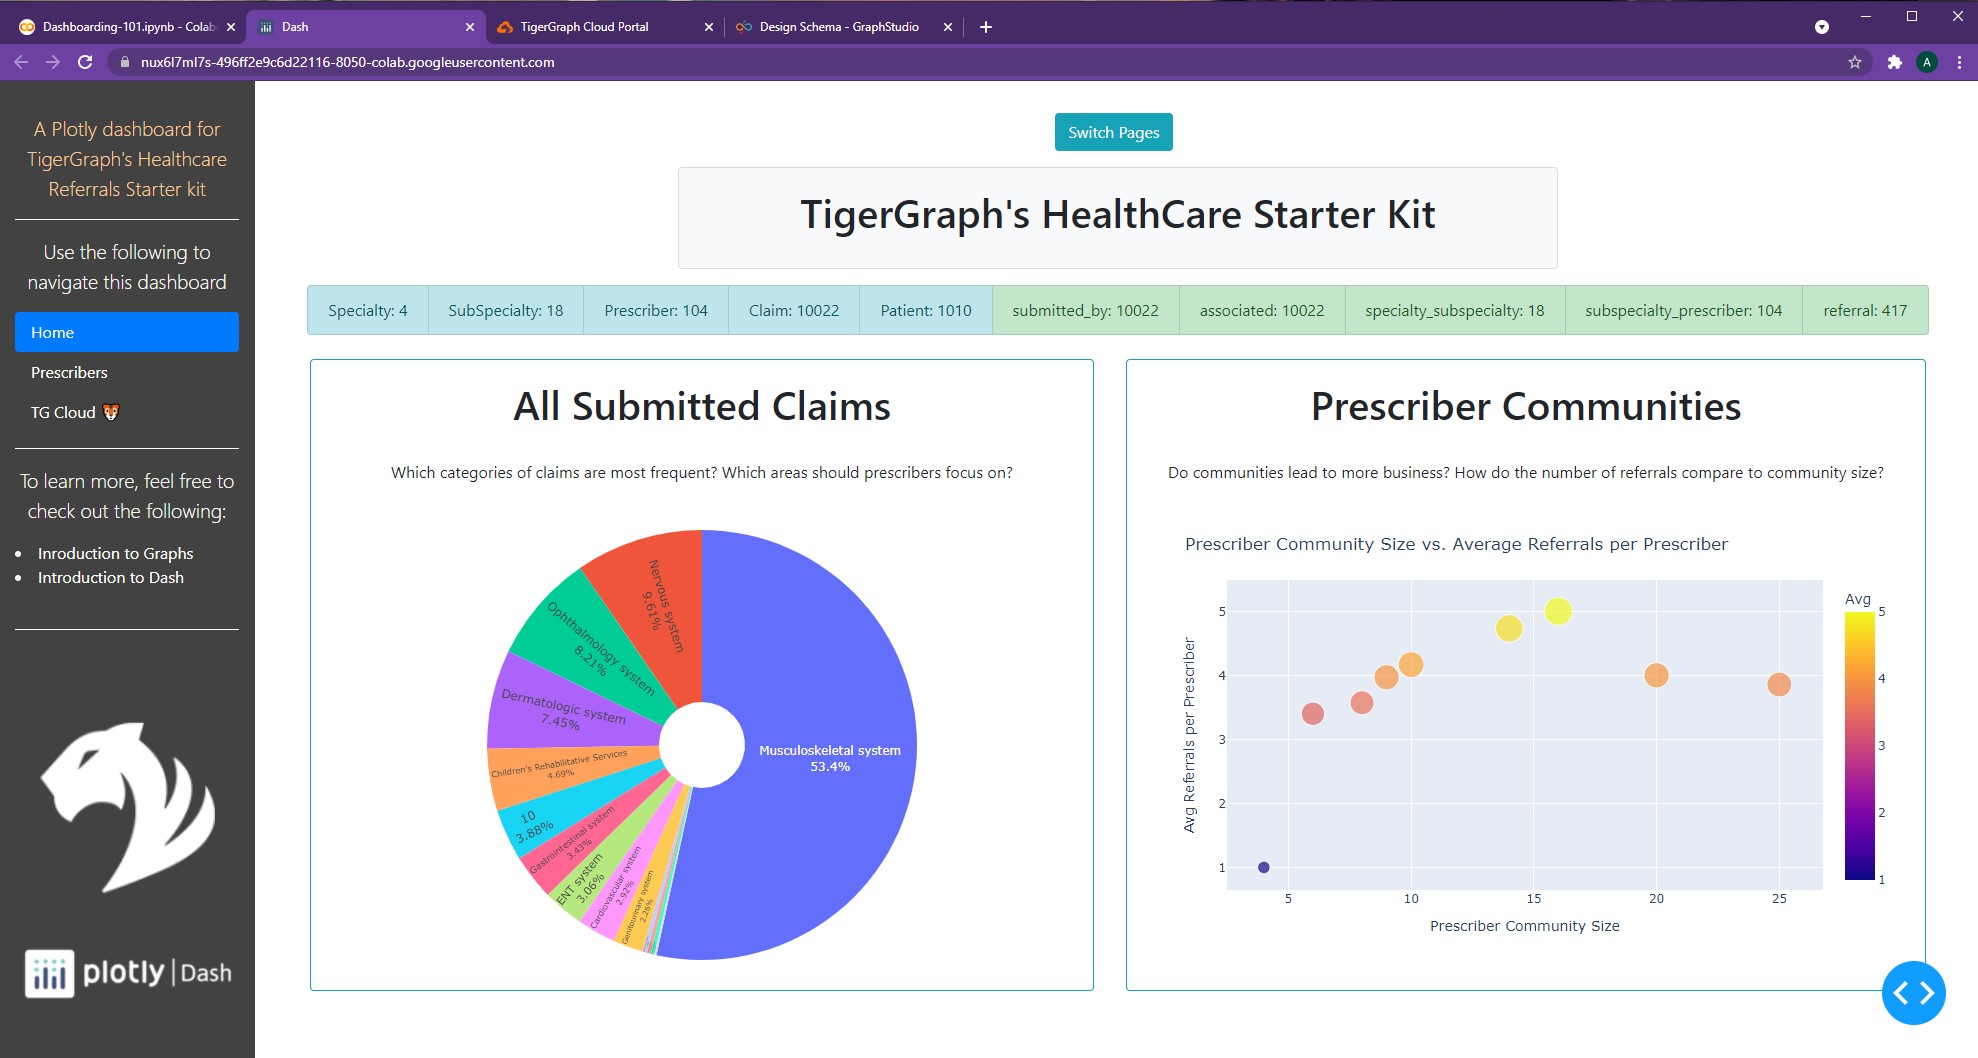
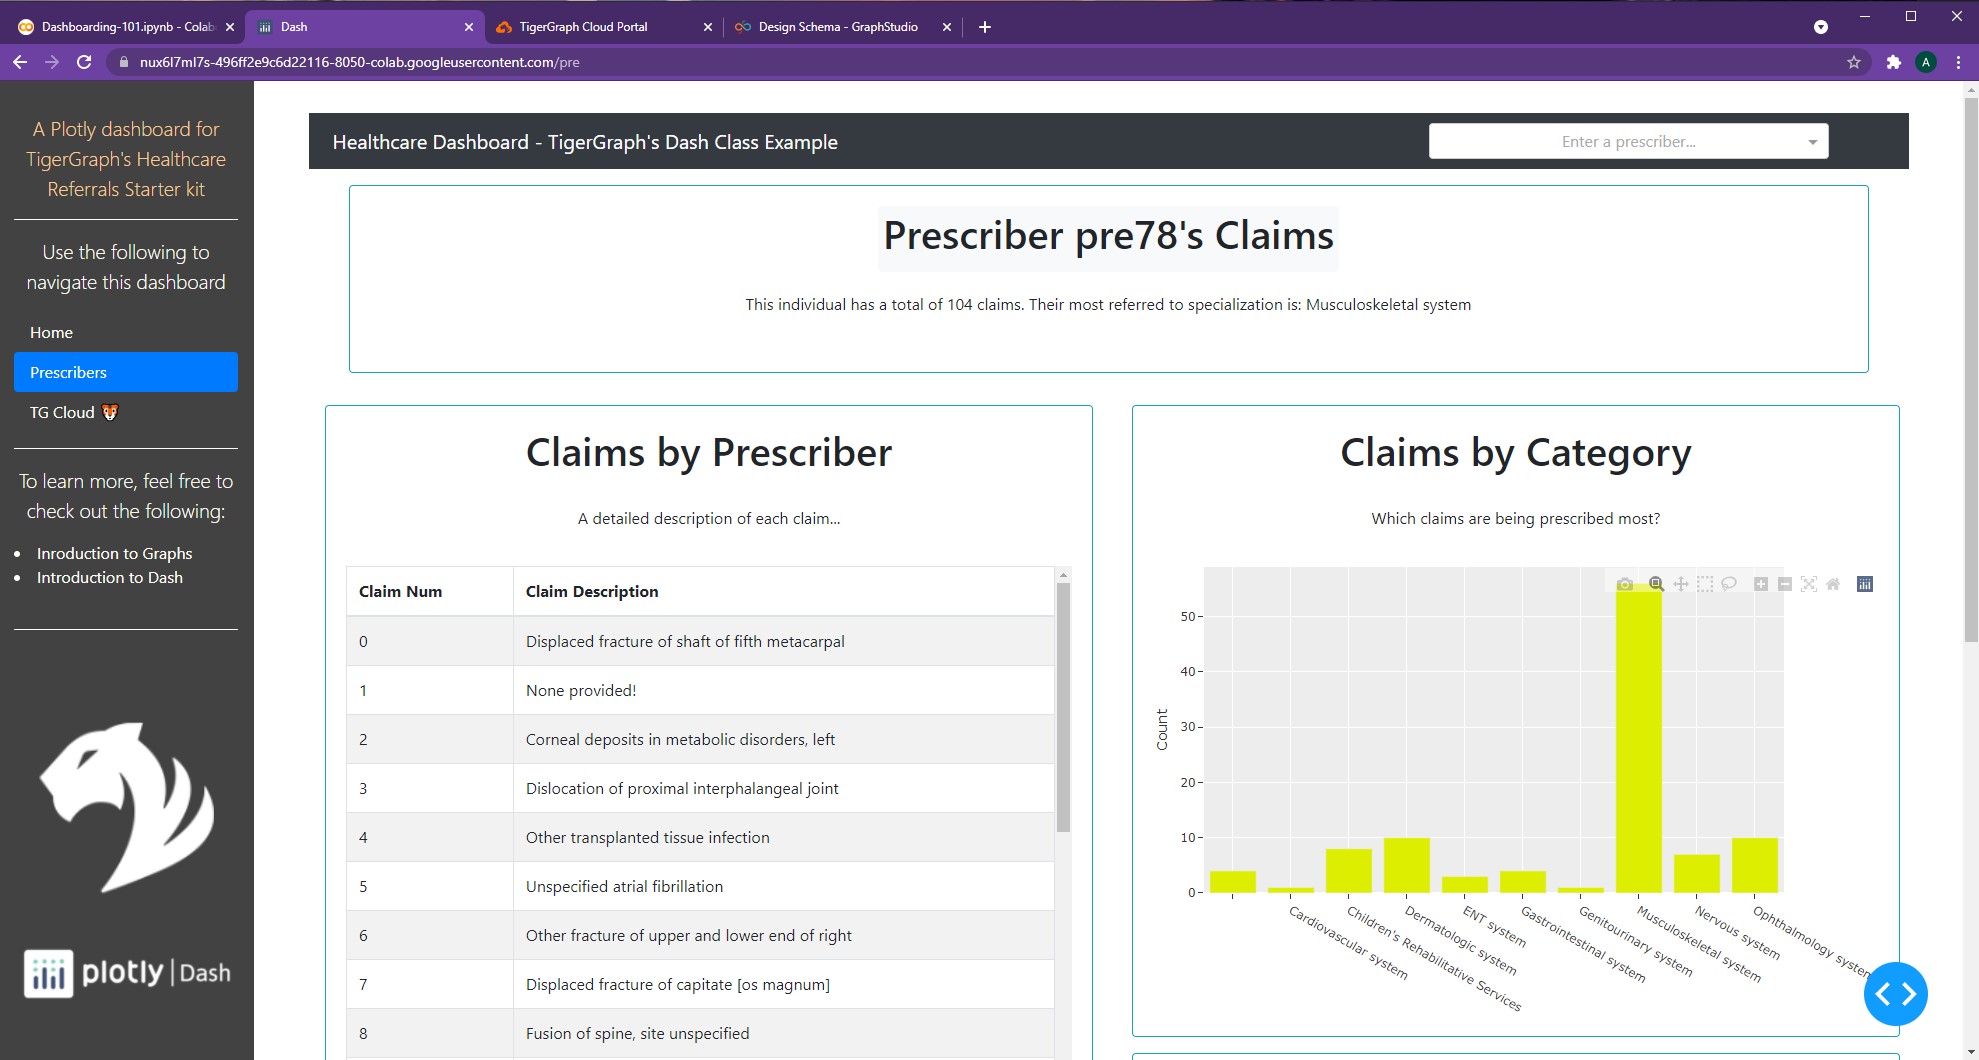
Awesome! And that's how to incorporate a sidebar into one's dashboard :)
NOTE: For more information on sidebars, feel free to check out the following resources: Dash Sidebar Video
Geronimo the gecko points to a small tornado in the distance,
"You must enter the tornado in order to reach the Elysium of Elements. I know it may seem scary, but it's the only way to find what you seek. Trust me, it'll take you to where you need to go."
And with that, Geronimo hops out of our hands and crawls away.
The tornado grows closer and closer. With our eyes closed, we step cautiously toward its roars. Yet for some strange reason, we don't feel anything. The tempestuous winds cannot be felt, and as it finally passes over us, we open our eyes to find ourselves in a strange new place.
A blue and orange-striped orb materializes next to us and begins to chirp.
-
All code segments from this chapter can be found in this Colab Notebook. Feel free to follow along! ↩
-
Everything we've installed so far (prerequistes for next section):
↩!pip install -q pyTigerGraph import pyTigerGraph as tg TG_SUBDOMAIN = 'healthcare-dash' TG_HOST = "https://" + TG_SUBDOMAIN + ".i.tgcloud.io" # GraphStudio Link TG_USERNAME = "tigergraph" # This should remain the same... TG_PASSWORD = "tigergraph" # Shh, it's our password! TG_GRAPHNAME = "MyGraph" # The name of the graph conn = tg.TigerGraphConnection(host=TG_HOST, graphname=TG_GRAPHNAME, username=TG_USERNAME, password=TG_PASSWORD, beta=True) conn.apiToken = conn.getToken(conn.createSecret()) !pip install -q jupyter-dash import dash import dash_html_components as html from jupyter_dash import JupyterDash import plotly.express as px import pandas as pd import plotly.graph_objects as go import dash_core_components as dcc !pip install dash-bootstrap-components import dash_bootstrap_components as dbc !pip install dash-cytoscape import dash_cytoscape as cyto