Sheriff Styles ⭐️

"I’m Sheriff Styles, in charge of all things related to design. Now see here, you fellers wouldn't happen to be on a quest to create the ultimate dashboard, now would yalls’?”
We nod quietly as she beams at us and points to our laptop. “Well then, show me whatcha got!”
As we show her our progress, from Installation Island to Dash’s Delta, she smiles.
“Now, that’s great y’all. But where’s the flavor? Where’s the heart? Where’s the style?”
She beckoned to a nearby treestump. “Now take a seat and pay close attention to this advice...”
Sheriff Style's Notes 01
Badges
Badges are an excellent way to better display important information, especially numbers. These elements can be accessed via the Dash Bootstrap components library and can easily be integrated into our dashboard.
Basic Badge
They can be used in conjunction with text, as shown below.
app = JupyterDash(__name__, external_stylesheets=[dbc.themes.BOOTSTRAP])

app.layout = html.Div(children=[
    html.H1(["Number of Animals: ", dbc.Badge("4", className="ml-1")]),
    html.H3(["Number of Countries: ", dbc.Badge("19", className="ml-1")]),
    html.H5(["Number of Lego Sets: ", dbc.Badge("None Yet!", className="ml-1")])
])

app.run_server(mode='external')
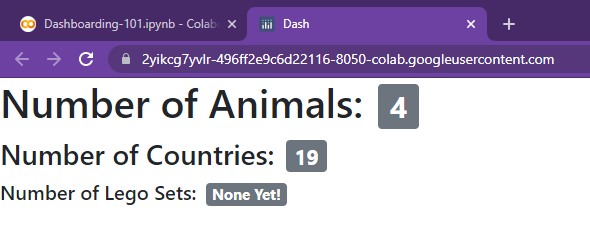
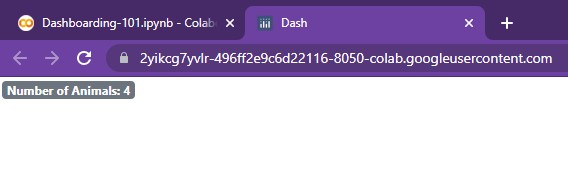
As seen, they match the size of the preceding text automatically. Additionally,
they can include both numbers and words. When used by
themselves, they default to the normal text size of html.P(), as shown below:
app = JupyterDash(__name__, external_stylesheets=[dbc.themes.BOOTSTRAP])

app.layout = html.Div([
    dbc.Badge("Number of Animals: 4", className="ml-1")
])

app.run_server(mode='external')
Coloring
These badges can be colored as well. They come in a total of eight different pre-built
color options, outlined here: primary, secondary, success, warning, danger, info, light.
In this example, they've all been wrapped into a row (placed side-by-side) so that the differences in colors
can easily be visualized.
app = JupyterDash(__name__, external_stylesheets=[dbc.themes.BOOTSTRAP])

colors = ['primary', 'secondary', 'success', 'warning', 'danger', 'info', 'light']

app.layout = html.Div(
                  dbc.Row(
                        [html.H1(["", dbc.Badge(value, color=value, className="ml-1")]) for value in colors] ,

                  style = {
                      "margin-left":"1rem"
                  }
            )
)

app.run_server(mode='external')
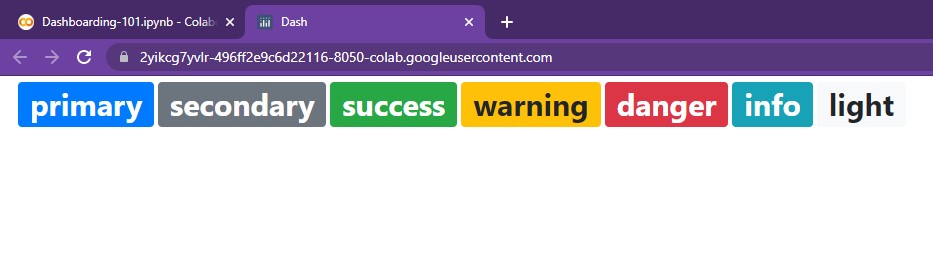
By wrapping each in an empty html.H1(), the size of
each badge can be easily increased (a nice little trick 😄).
Pills, Links
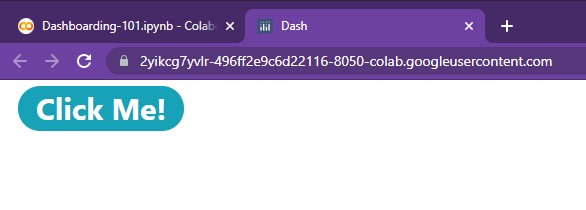
Badges can also be reshaped into pills (with ovalish corners) and have embedded links. The
pills can be set simply via pill=True and the embedded link can be
changed via the href argument.
app = JupyterDash(__name__, external_stylesheets=[dbc.themes.BOOTSTRAP])

app.layout = html.Div(
                  dbc.Row([
                            html.H1(["", dbc.Badge("Click Me!", color='info', pill=True, href="https://google.com", className="ml-1")])
                          ],
                  style = {
                      "margin-left":"1rem"
                  }
            )
)

app.run_server(mode='external')
And those are the core functionalities of badges! As we'll see in the ensuing chapter (TigerGraph Tundra), they can come in quite handy when calling attention to text-based information...
NOTE: For more information, feel free to check out the following resources: dbc.Badge()
The Sheriff continues onwards...
Sheriff Style's Notes 02
HTML Elements
We can further modify the layout of our dashboard, especially text, by using Dash’s HTML elements.
Centering
Going back to our title card from Dash's Delta, we can easily center text using html.Center().
titleCard =  dbc.Card([
                dbc.CardBody([
                              html.H1("Welcome to Dash!", className='card-title'),
                            ])
              ],
              color='dark', # Options include: primary, secondary, info, success, warning, danger, light, dark
              inverse=True,
              style={
                  "width":"55rem",
                  "margin-left":"1rem",
                  "margin-top":"1rem",
                  "margin-bottom":"1rem"
                  }
            )

app = JupyterDash(__name__, external_stylesheets=[dbc.themes.BOOTSTRAP])

app.layout = html.Div([
   dbc.Row([
            html.Center(titleCard),
           ],
           justify="center",
           style = {
               "margin-left": "0.5rem"
           }
   ),
])

app.run_server(mode='external')
This can be used to center any component, beyond just text and cards!
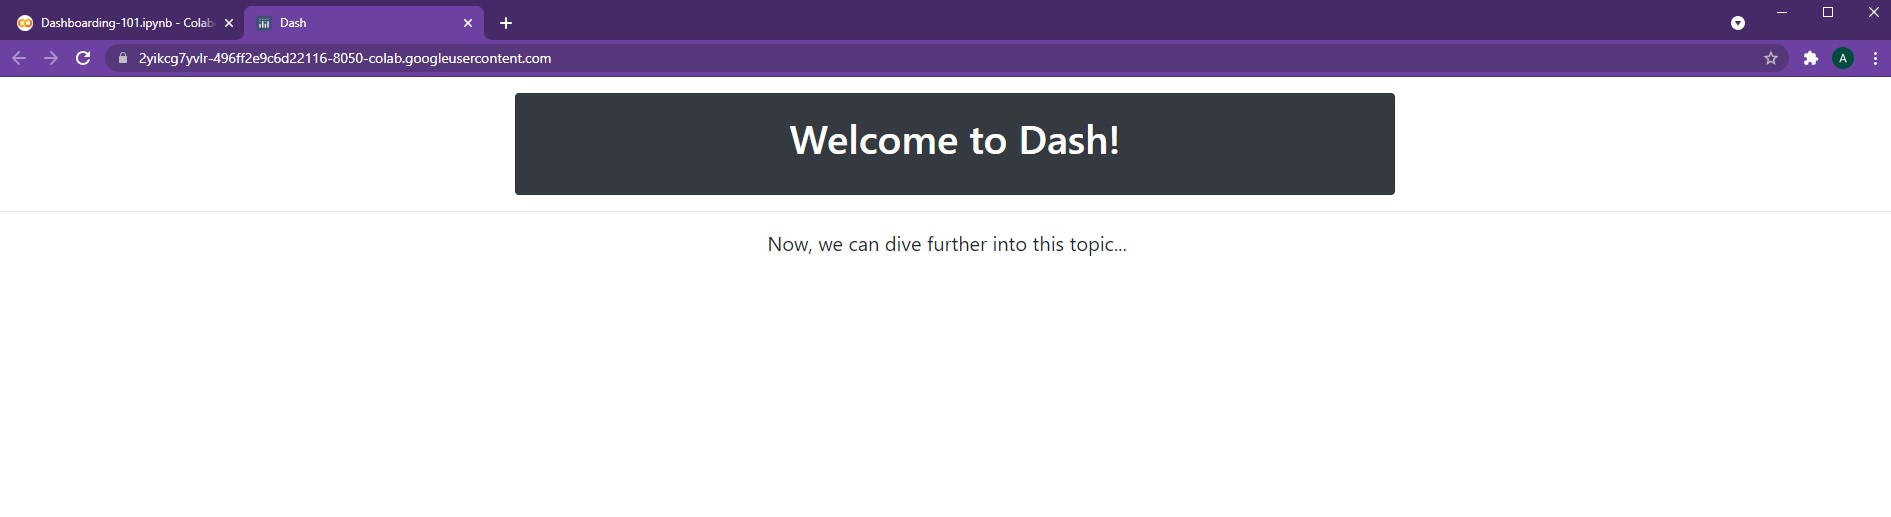
Horizontal Rule (Hr)
The html.Hr() function creates a thin horizontal line that stretches across the page. This
can be used to separate distinct sections from one another or for easy aesthetic design.
For example,
app = JupyterDash(__name__, external_stylesheets=[dbc.themes.BOOTSTRAP])

app.layout = html.Div([
              html.Center(titleCard),
              html.Hr(),
              html.Center(html.P("Now, we can dive further into this topic...", style={'fontSize':20}))
])

app.run_server(mode='external')
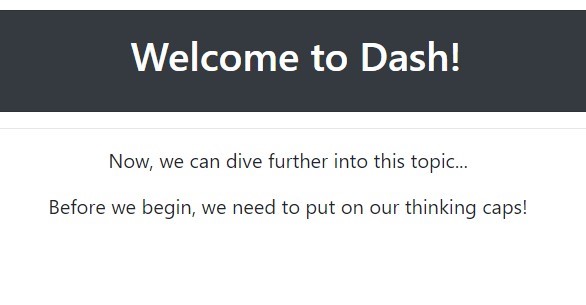
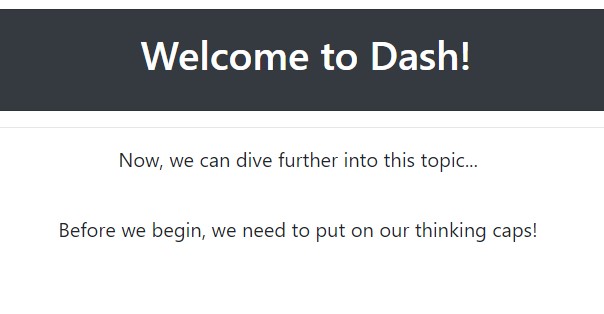
Line Break (Br)
The html.Br() function creates a small line break that can be used to separate text,
paragraphs, or components. The size of the line break can be seen below:
app = JupyterDash(__name__, external_stylesheets=[dbc.themes.BOOTSTRAP])

app.layout = html.Div([
              html.Center(titleCard),
              html.Hr(),
              html.Center(html.P("Now, we can dive further into this topic...", style={'fontSize':20})),
              html.Br(),
              html.Center(html.P("Before we begin, we need to put on our thinking caps!", style={'fontSize':20}))
])

app.run_server(mode='external')
And those are the core HTML components to help with style!
"Next up, an easier way to format text!" exclaims the Sheriff.
Sheriff Style's Notes 03
dcc.Markdown()
Markdown allows for the insert of Markdown into Dash (pretty intuitive naming 😅). It's quite straightforward!
app = JupyterDash(__name__, external_stylesheets=[dbc.themes.BOOTSTRAP])

app.layout = html.Div([dbc.Col(
              dcc.Markdown("""
                            # This is a title!
                            Hello There! This is in **bold** while this is in *italics*
                            * Neat, it's a list :)
                            * Woah, possible foreshadowing?

                            Check out [Google](https://google.com)
                           """
                          )
              )
])

app.run_server(mode='external')
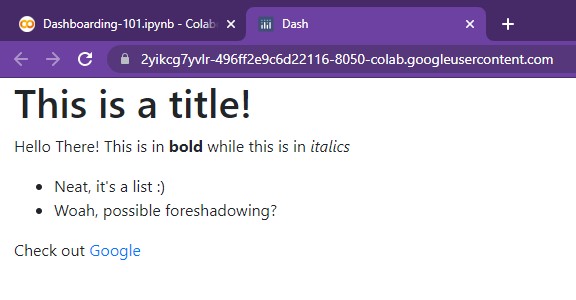
In order to create a title, we can simply use the #. Bolded text is performed using
the ** symbols, while italics are added via the * symbol. In order to create lists,
we can use the * symbol (asterisk with a space). Links are as simple as
adding the visible text in square brackets and placing the link itself in parenthesis.
NOTE: For more information, feel free to check out the following resources: dcc.Markdown()
"The last thing we need to cover are lists!"
Sheriff Style's Notes 04
List Group
Dash Bootstrap's List Groups allow for the creation of stylish lists with ease. These lists can be used to store information, serve as embedded links, and help users better navigate and understand the layout of one's dashboard.
To create a basic list, we use the following:
app = JupyterDash(__name__, external_stylesheets=[dbc.themes.BOOTSTRAP])

app.layout = html.Div([
               dbc.ListGroup([
                  dbc.ListGroupItem("First is the worst!"),
                  dbc.ListGroupItem("Second is the best!"),
                  dbc.ListGroupItem("Third is the one with the Treasure Chest!")
               ]),
])

app.run_server(mode='external')
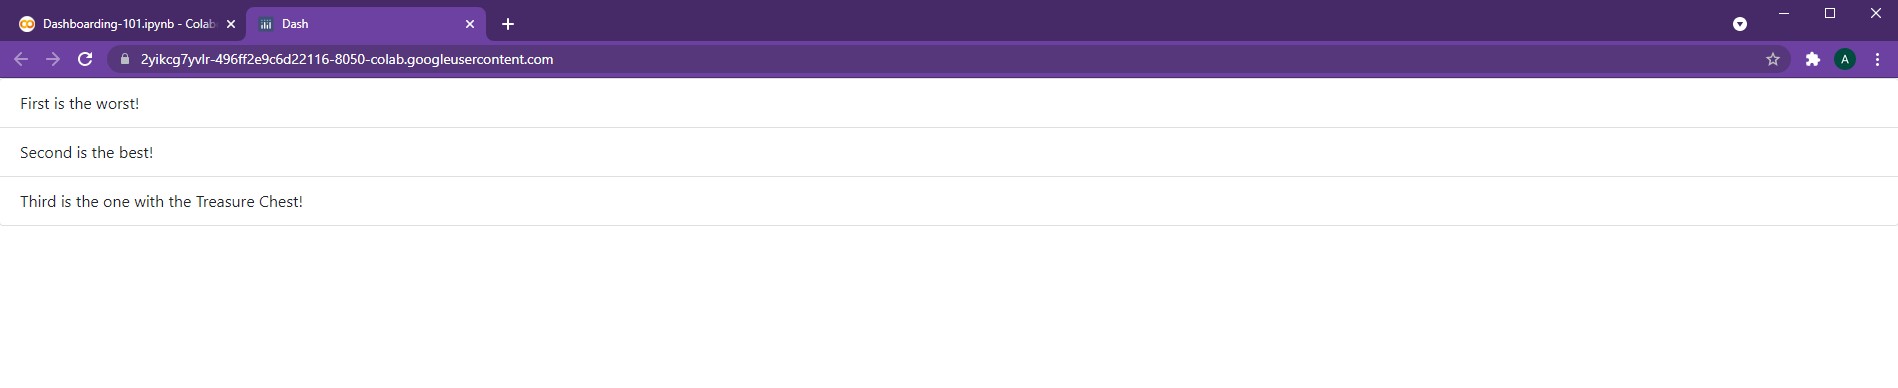
The dbc.ListGroup() element simply holds different list group items.
However, this list
spans the entire width of the page (or its parent component) by default. In order to adjust
its width, we can wrap the List Group within a dbc.Col() element from earlier.
app = JupyterDash(__name__, external_stylesheets=[dbc.themes.BOOTSTRAP])

app.layout = html.Div([dbc.Col(
               dbc.ListGroup([
                  dbc.ListGroupItem("First is the worst!"),
                  dbc.ListGroupItem("Second is the best!"),
                  dbc.ListGroupItem("Third is the one with the Treasure Chest!")
               ]),
               width=4
          )
])

app.run_server(mode='external')
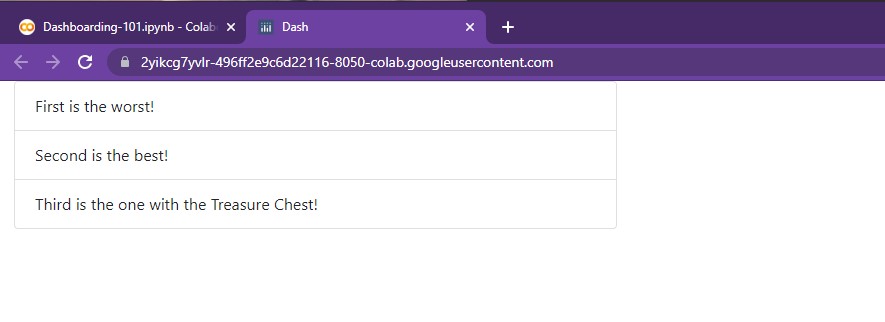
There we go, much better! Now let's add some style...
Coloring Cells
In order to add color to each list item, we can simply use the color argument:
app = JupyterDash(__name__, external_stylesheets=[dbc.themes.BOOTSTRAP])

app.layout = html.Div([dbc.Col(
               dbc.ListGroup([
                  dbc.ListGroupItem("First is the worst!", color='danger'),
                  dbc.ListGroupItem("Second is the best!", color="success"),
                  dbc.ListGroupItem("Third is the one with the Treasure Chest!", color="info")
               ]),
               width=4
          )
])

app.run_server(mode='external')
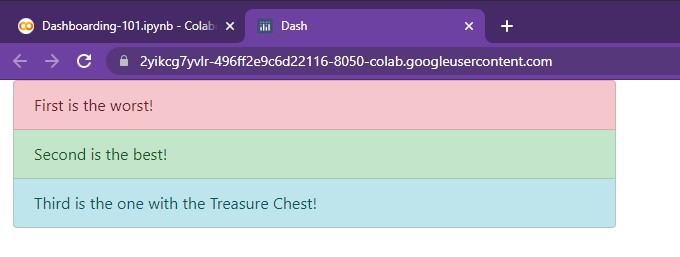
As with other bootstrap components, the pre-built color options carry over in name and hue.
Horizontal List
Instead of keeping each list item stacked vertically, we can also arrange them horizontally.
app = JupyterDash(__name__, external_stylesheets=[dbc.themes.BOOTSTRAP])

app.layout = html.Div([dbc.Col(
               dbc.ListGroup([
                  dbc.ListGroupItem("First is the worst!", color='danger'),
                  dbc.ListGroupItem("Second is the best!", color="success"),
                  dbc.ListGroupItem("Third is the one with the Treasure Chest!", color="info")
                ],
               horizontal=True
               ),
               width=6
          )
])

app.run_server(mode='external')
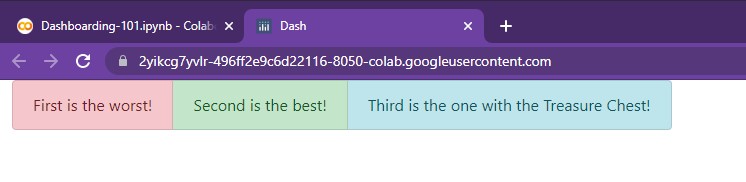
As seen, it's just a matter of adding the horizontal argument to our dbc.ListGroup().
NOTE: For more information, feel free to check out the following resources: dbc.ListGroup()
"And voila, now you have most of the core tools you need to begin styling," finishes the Sheriff.
She smiles at us and points towards the horizon,
"As for where you're going to use these elements, you'll find your answer at the TigerGraph Tundra, the next step of your journey. Follow these rivers east, and they'll lead you to what you seek!"
-
All code segments from this chapter can be found in this Colab Notebook. Feel free to follow along! ↩
-
Everything we've installed so far (prerequistes for next section):
↩!pip install -q pyTigerGraph import pyTigerGraph as tg TG_SUBDOMAIN = 'healthcare-dash' TG_HOST = "https://" + TG_SUBDOMAIN + ".i.tgcloud.io" # GraphStudio Link TG_USERNAME = "tigergraph" # This should remain the same... TG_PASSWORD = "tigergraph" # Shh, it's our password! TG_GRAPHNAME = "MyGraph" # The name of the graph conn = tg.TigerGraphConnection(host=TG_HOST, graphname=TG_GRAPHNAME, username=TG_USERNAME, password=TG_PASSWORD, beta=True) conn.apiToken = conn.getToken(conn.createSecret()) !pip install -q jupyter-dash import dash import dash_html_components as html from jupyter_dash import JupyterDash import plotly.express as px import pandas as pd import plotly.graph_objects as go import dash_core_components as dcc !pip install dash-bootstrap-components import dash_bootstrap_components as dbc