Exquisite Examples 🥳
We've established the power of dashboards and TigerGraph. To further solidify these claims, we can take a look at the following dashboards put together using TigerGraph and Plotly Dash 😊.
New feature, coming soon! If you wish to feature your dashboards here, make sure to be on the lookout for a submission form under the Community tab. Currently in the works!
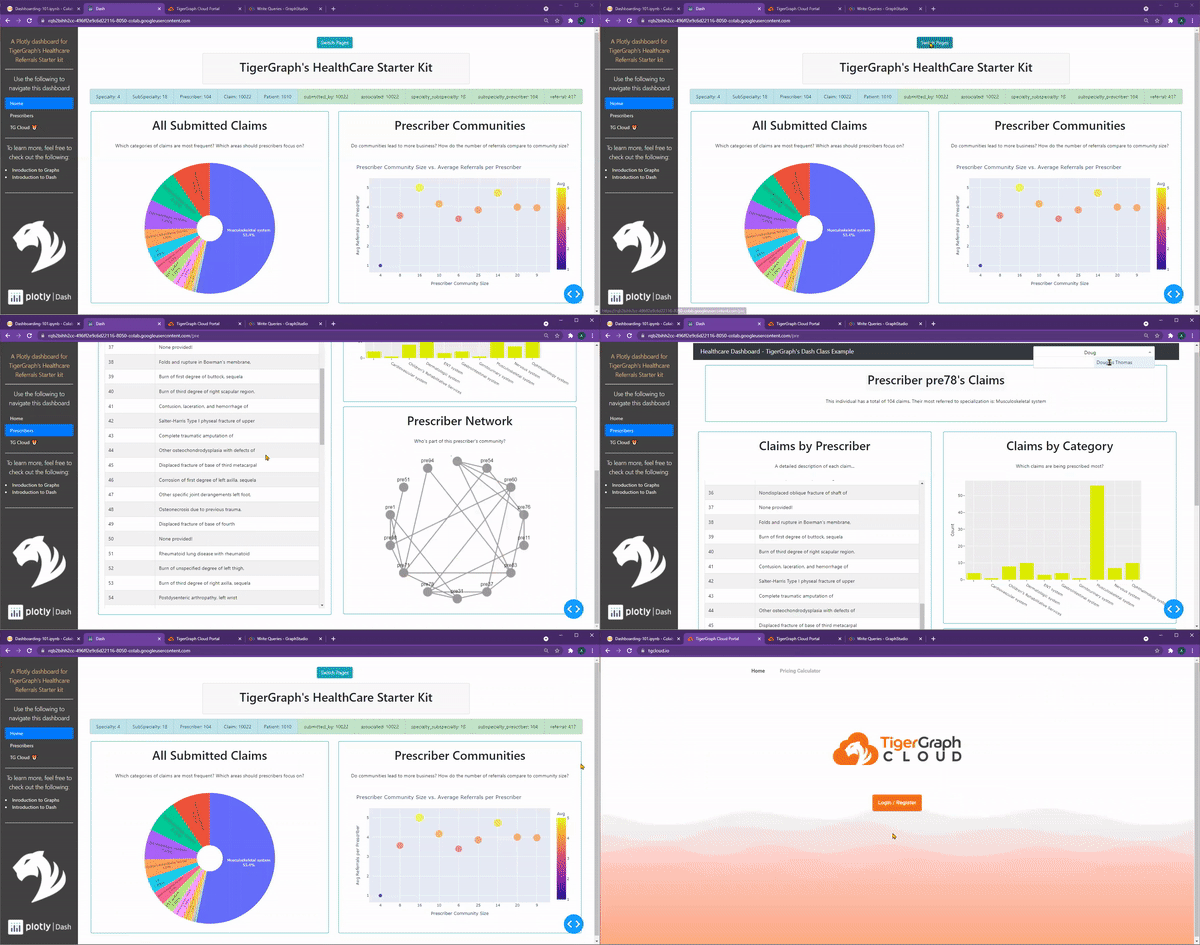
Healthcare Referrals
This interactive dashboard visualizes TigerGraph's Healthcare Starter Kit. Simply by following the twelve chapters outlined in Quick Start or Adventure, you can learn how to create your own!
TigerGraph's Healthcare Starter Kit

COVID-19 in South Korea
This interactive dashboard visualizes TigerGraph's COVID-19 Starter Kit. It comes alongside a Google Colab Notebook as well as a Medium Blog Post for users to follow along closely.
Check out this YouTube video of the dashboard in action!
TigerGraph's COVID-19 Starter Kit
Movie Reviews Starter Kit
This interactive dashboard visualizes TigerGraph's Movie Starter Kit. It comes alongside a Google Colab Notebook as well as a Medium Blog Post for users to follow along closely.
Check out this YouTube video of the dashboard in action!
TigerGraph's Movie Starter Kit
New York's Energy and Weather
This interactive dashboard visualizes New York's Energy and Weather data. It comes alongside a Google Colab Notebook for users to follow along closely and was presented at a webinar.
Energy + Weather Dataset
Want to learn how to create your own? Make sure to check out either the Quick Start or the Adventure tabs. While both cover the same content, the Dashboarding Adventure is wrapped around a story to help make the learning journey more immersive!
Either way, happy dashboarding! 🥳🥳🥳