Sailing through Setup Sea 🌊

“Long ago, avid data scientists and developers sought for a way to visualize their vast collections of information. Various complicated systems were all used throughout the land. But then, in 2012, a group of four Canadian explorers discovered the power of a tool called Plotly.
Plotly transformed life for every creator. Dashboards and visualizations could be put together in mere minutes, all in Python. Gone were the days of laboring for weeks learning out how to create intricate, multi-layered applications. With Plotly, anyone could create a dashboard.”
The pirates turn and point to our laptop.
“Every dashboarder needs to learn how to harness the power of Plotly. Creating your first dashboard isn’t as hard as you may think. Follow along lads, and we’ll tell you what we know.”
Eager to learn more, we begin to jot down their words…
Plotly Pirates' Notes 01
Proper Prerequisites
While TigerGraph’s Cloud Portal provides the solution, data, and queries needed to analyze our graph, we need the help of another tool to create our dashboard. With Plotly, the task of doing so is made simple, intuitive, and easy.
To begin, we must first install the proper packages.
When running Plotly via a Google Colab, we will first need to use the following command:
!pip install -q jupyter-dash
Jupyter-dash allows the dashboard to be configured for modification via a
Python Notebook. This way, the dashboard is updated in real-time with the
modification of any cells. Without using the jupyter-dash package, every
change made to the dashboard would have to be followed by a recompilation
of the app (quite tedious).
Now, we can import our Python libraries with the following line:
import dash
from jupyter_dash import JupyterDash
import dash_html_components as html
The library dash_html_components allows for access to Plotly Dash’s HTML
components, allowing us to display HTML elements such as text and linebreaks.
We'll cover more of these in the ensuing sections!
At this point, the pirates pause.
“We only know these packages for now. Pilaging doesn’t leave much time to learn further. At Port Plotly, ya’ll find what you need from the locals. Theys’ a lot more knowledgeable.” explains the first.
“But that’s okay”, finishes the second, “these two packages are quite powerful...”
Plotly Pirates' Notes 02
Functioning First App
In order to create our first app, we can simply run the following lines:
app = JupyterDash(__name__)

app.layout = html.Div(children=[
    html.P(children='Hello Dash'),

])

app.run_server(mode='external')
Running the following produces the following output:
Dash App running on:
http://127.0.0.1:8050/
Clicking on the link takes us to our first dashboard!
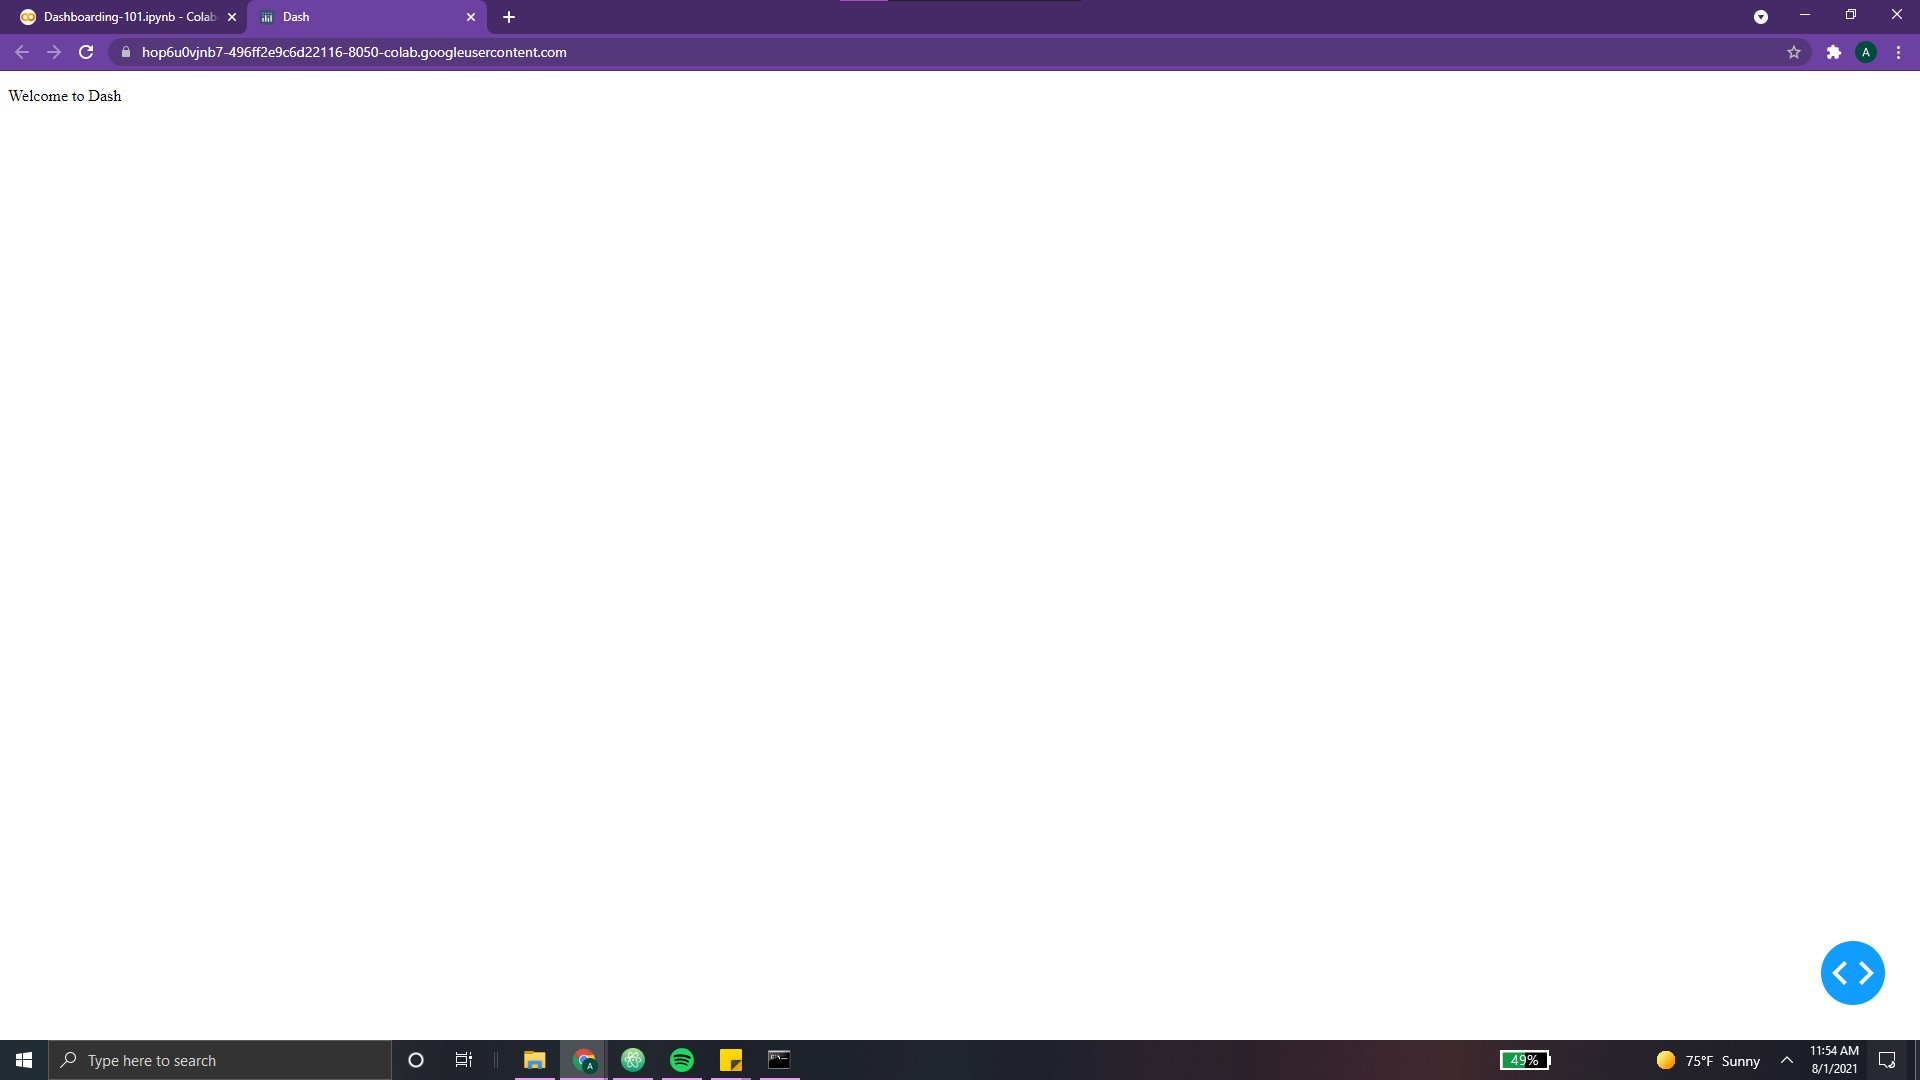
Great! Albeit, quite simple 😅.
Breaking it down, we can see that our first line initialized the dash app.
Since we are running from the Google Colab Notebook, we will use the
JupyterDash() constructor instead of the standard app=dash.Dash() constructor.
Next, we define the app’s layout.
Using an HTML .Div() element, we can divide our content into different
sections. It is simply a container used to hold other components and
establish a structure in our dashboard. For example, our Div element
currently contains one element, represented by the attribute children
= [...]. Any components contained in the attribute “children” will
belong to this html.Div() element. Each
children component must be separated by a comma.
We can try adding another html.P (a simple paragraph) to our app:
    app.layout = html.Div(children=[
        html.P(children='Hello Dash'),
        html.P(‘Guess who’s back?’),
    ])
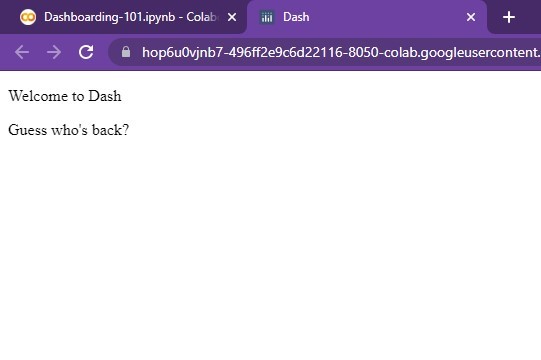
Running this will produce the following output to the right:
Ahh, you might have noticed that we’ve omitted the children attribute in the second html.P() statement. This is because ‘children’ is optional and does not to be specified. For example,
app.layout = html.Div([
    html.P('Hello Dash'),
    html.P(‘Guess who’s back?’),
])
Running this will produce the following output to the right:
See, same result as above!
NOTE: For more information on .Div(), make sure to check out the following resources:
html.Div()
The pirates grin upon seeing our wide-eyed surprise. “Now, let’s tie it together with those TigerGraph texts”, they exclaim, pointing at our three manuscripts from the island.
Plotly Pirates' Notes 03
Using Layout Functions
We can create a function to return information to be displayed in our app.
This will help make our layout cleaner, more readable, and easier to scale.
All content can simply be wrapped in an html.Div() element.
To begin, we can add the following functions and change our layout:
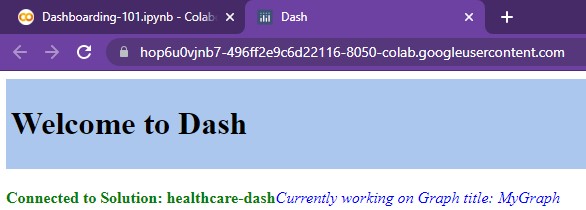
def setup_TG():
  row = html.Div([
              html.P("Connected to TigerGraph Solution Subdomain:", TG_SUBDOMAIN)
              html.P("Currently working on Graph title:", TG_GRAPHNAME)
  ])
  return row


app.layout = html.Div([
    html.P(“Welcome to Dash”)
    setup_TG()
])
And voila, as seen, our app now looks like the following:
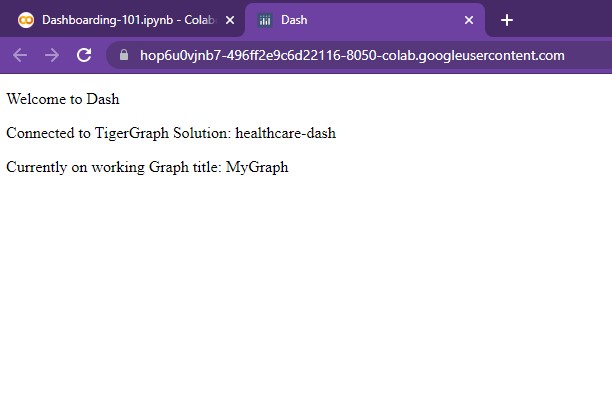
These functions can come in quite handy when creating complicated layouts.
The pirates turn and point. In the distance, the faint outline of a port can be seen.
“Land ho! Well lads, time to finish up with the last section for today… adding a little bit of flavor.”
Plotly Pirates' Notes 04
Transforming Text
Dash’s text elements are quite powerful. Here are a few simple ways to spice it up!
We can modify our simple app as follows:
1 2 3 4 5 6 7 8 9 10 11 12 13 14 15 16 17 18 19 20 21 22 | |
Let's break it down, component by component!
HTML Headers
One of the easiest ways to spice up one's dashboard is to vary the text styles. This can be done using simple HTML header elements (H1, H2, H3, H4, H5, H6). A table showing each one's output can be found below.
| Header 1 | Headers 4 - 6 | Header 3 | Header 4 | Header 5 | Header 6 |
|---|---|---|---|---|---|
What's Up? |
Good Day. |
Bless You! |
Well done. |
Happy Birthday! |
Goodbye? |
The specific style of each will change based on the font. However, the relative sizes can be seen above.
NOTE: For more information on HTML, feel free to check out the following resources: Dash Headers, Dash HTML
In line 18 of our code snippet, we see that our html.P() element is now html.H1().
18 | |
Pretty simple and effective! Ahh, you may have noticed the html.Div() element that
the header is wrapped in. Let's take a closer look at the reason for this...
Style Dictionary
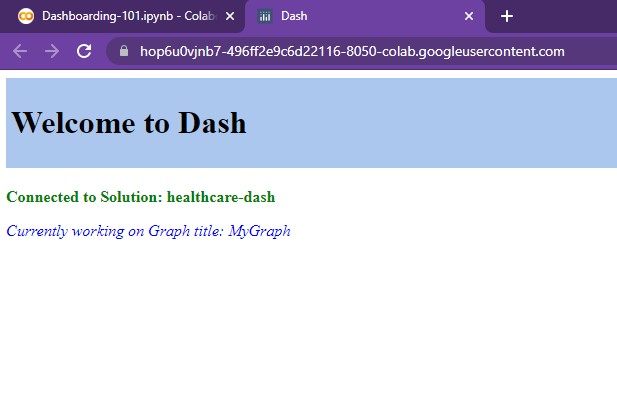
One of the best ways to style a dashboard is to use a style dictionary. In these dictionaries, one can specify attributes such as background color, padding, margins, font style, font color, etc.
In lines 1- 5, we explicitly create a style dictionary titled TITLE_STYLE.
1 2 3 4 5 | |
This dictionary is then passed into the html.Div() element which contains our header. As a result,
the header is given extra padding, margin, and a light-blue background. Pretty straightforward!
This style dictionary doesn't have to be stored in a variable.
In lines 9 and 10, we explicitly change the colors of each html.P() using the keyword style.
9 10 | |
NOTE: Color can take both keywords (ex. common colors like red, orange) as well as hex values (ex. 'DD659F')
This brings us to our next point, the html.B() and html.I() used in lines 9 and 10.
Html.B(), Html.I()
In order to bold or italicize sections of text, we can simply use html.B() and html.I()
These elements can stand on their own without being wrapped in html.P() elements. However, this removes
the division between two lines. For example, the following two lines produce the following output:
9 10 | |
NOTE: For more information on these two elements, feel free to check out the following: html.B(), html.I()
There are so many more ways to transform text! We'll cover other methods in Chapter 05 - Sheriff Styles!
As we pull into Port, the pirates help us get out of their canoe.
“Here, you lads will learn more about Plotly. Pay careful attention and make sure to note everything down in there," advises the first, pointing to our laptop. The second tips his hat to us,
“Fair winds to thee good friends! Cast off!”
And with that, the peculiar pirates had left. Turning around, a large sign greets us,
“Welcome to Port Plotly! A one-stop-shop for data analytics and visualization!”
-
All code segments from this chapter can be found in this Colab Notebook. Feel free to follow along! ↩
-
Everything we've installed so far (prerequistes for next section):
↩!pip install -q pyTigerGraph import pyTigerGraph as tg TG_SUBDOMAIN = 'healthcare-dash' TG_HOST = "https://" + TG_SUBDOMAIN + ".i.tgcloud.io" # GraphStudio Link TG_USERNAME = "tigergraph" # This should remain the same... TG_PASSWORD = "tigergraph" # Shh, it's our password! TG_GRAPHNAME = "MyGraph" # The name of the graph conn = tg.TigerGraphConnection(host=TG_HOST, graphname=TG_GRAPHNAME, username=TG_USERNAME, password=TG_PASSWORD, beta=True) conn.apiToken = conn.getToken(conn.createSecret()) !pip install -q jupyter-dash import dash import dash_html_components as html from jupyter_dash import JupyterDash